Quick answer: AdClarity is a competitor ad intelligence tool that shows you exactly where, when, and how other brands are spending on digital ads.
It tracks campaigns across channels like Facebook, YouTube, Google Display, TikTok, and more—giving you real data on ad creatives, placements, spend estimates, impressions, and clicks.
Think of it like having a spy inside your competitor’s ad team, without the legal trouble.
I’ve been working in marketing long enough to know how complicated it can be. It sometimes feels like you’re trying to run a race blindfolded when you have no idea of where the track goes.
I remember when getting competitive intel meant cobbling together screenshots from Facebook’s Ad Library, plus a few random blog posts that might or might not be up to date.
It was messy, slow, and more than a little exhausting. Now we have new tools: like AdClarity from the Semrush App Center.
If you haven’t heard of it yet, it’s an app created by BIScience, built to automatically capture all the crucial insights you need into what your competitors are doing in digital ads to win customers.
Today, I’m going to walk you through everything you need to know about this tool: the features, pricing, how it works, and whether it’s worthwhile.
What Is AdClarity?
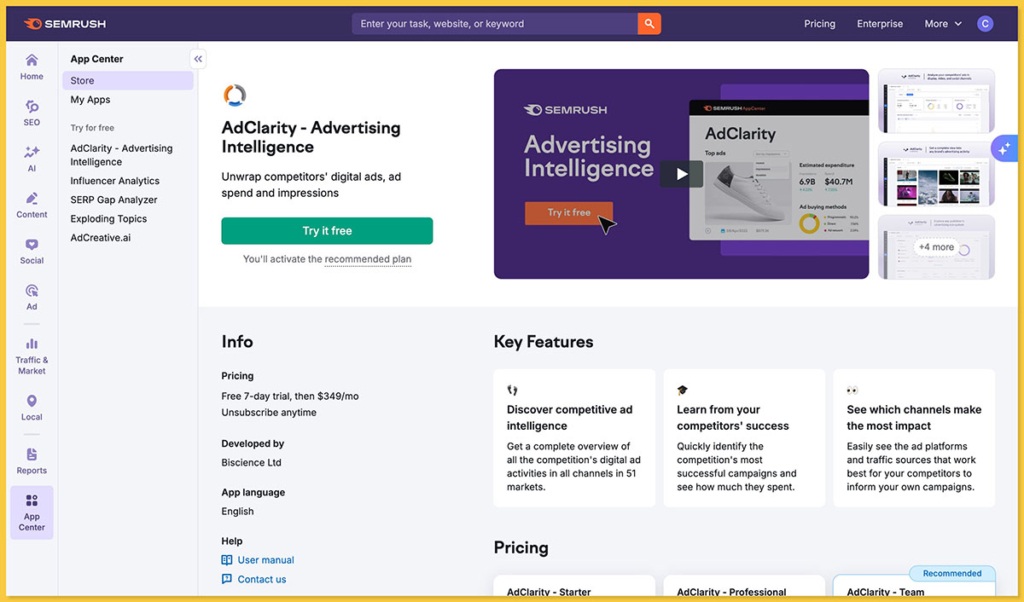
AdClarity is a powerful advertising intelligence tool available in the Semrush App Center. It’s designed to pull back the curtain on competitors’ ad strategies, giving you detailed insights into how others are running their campaigns.
Here’s the gist: AdClarity hoovers up data from over 650,000 publishers across 51 countries, then spits out clean, colorful dashboards that show you who’s buying which ads, on what networks, for how long, and (roughly) how much they’re spending.
The first time I opened it, I felt like I’d stumbled into some secret control room: complete with charts and graphs mapping the entire digital ad ecosystem.
You can filter everything by channel: display, video, and social..
The platform keeps updating, so you can watch campaigns rise and fall over weeks or months.
You can compare one brand’s creative to another’s, see when spending spikes, and figure out which publishers are getting the biggest chunks of their budget.
How AdClarity Works Under the Hood
AdClarity isn’t just guessing or scraping a couple of landing pages. It’s way more sophisticated (and honestly, a little bit unnerving in its thoroughness).
Here’s what’s happening behind the scenes:
At the core of AdClarity is a global data panel of over 25 million users, tracking ads across Facebook, LinkedIn, Instagram, X, TikTok, Pinterest, Google Display, and YouTube Ads.
It captures key stats like impressions, costs, views, and clicks, giving you real insight into how your competitors are reaching their audience—and how well it’s working.
This panel is constantly capturing which ads show up, where they appear, how often they’re served, and in what format.
Basically, it’s as if millions of little digital antennae are scattered across the internet, quietly collecting receipts on the world’s ad spend.
But raw data is messy. So AdClarity runs all that intel through a layer of machine learning that does the heavy lifting:
- Cleaning and normalizing the data (because ad formats and placements are a wild, inconsistent jungle)
- Mapping impressions to known brands and campaigns
- Estimating spend based on historical patterns, frequency, and network pricing
- Organizing everything into neat dashboards you can actually make sense of
I also love that it doesn’t just stop with display ads. One of my favorite features is how it handles geo-targeted campaigns, stuff you’d never see unless you happened to be physically located in, say, Helsinki or Sydney.
AdClarity solves that with what they call Geo Surfing, which is essentially a fancy way of saying they run virtual machines in different countries to see what locals are seeing.
So when you pick a market filter, you’re not relying on generic data, they’ve actually “stood there” digitally to observe which ads are firing in that region.
What is Ad Clarity? Features Breakdown
AdClarity gives you so many options, and tons of features to experiment with. There are even filters so you can choose your default currency, metrics, and everything else.
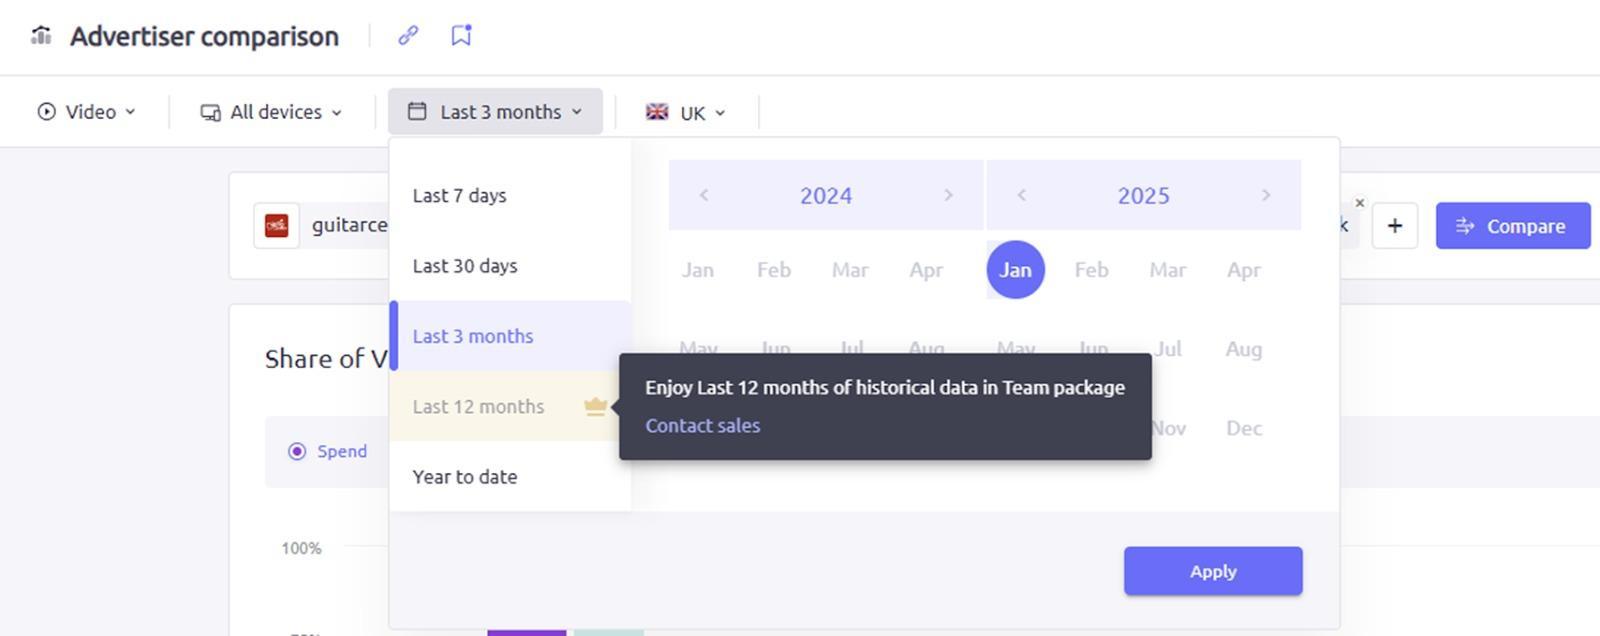
When you first step up the platform, you’ll choose the market (in this case market=geo) you want to base your report on, then pick the channels you’re interested in, so let’s start there.
Channels & Formats
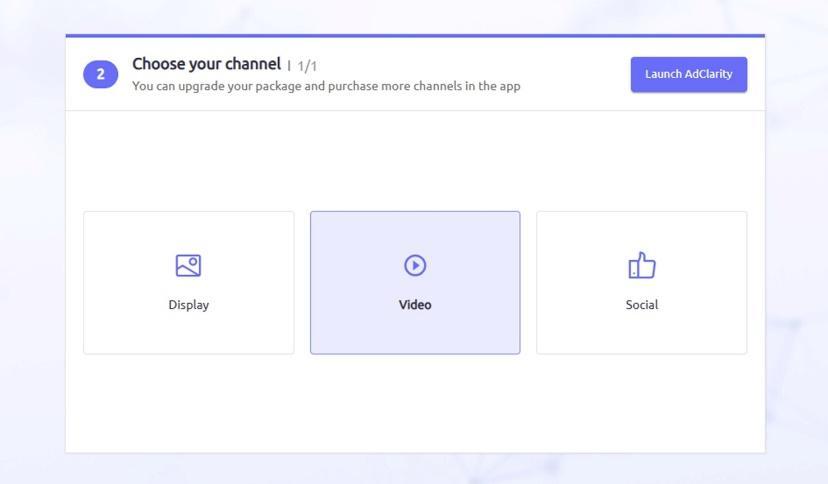
After you pick your market, you can start looking at channels. Your options include:
- Display (think banners, native placements, skins)
- Video (pre-rolls, mid-rolls, in-feed)
- Social (Facebook, Instagram, YouTube, Linkedin,, X, TikTok, and Pinterest)
And you don’t just get a generic list. You can filter by device (desktop, mobile, or all) and market (51 countries). You can also generate multiple reports for one strategy, which is nice.
Types of Reports
This is where the magic starts to feel actionable. AdClarity breaks everything into four main report types:
- Advertiser Reports: This is your backstage pass to any brand’s strategy. You see what they’re running, when they started, how long campaigns lasted, and which networks they’re using to buy inventory.
- Publisher Reports: Ever wondered who’s selling the ad space? This shows which sites or apps are carrying ads for a particular vertical or brand.
- Campaign Reports: Here’s where you get the creative breakdown, what banners, videos, or carousel ads look like, which calls-to-action they use, and how often each variant appears.
- Keyword Reports: This one’s more search-focused: which campaigns tie to specific keywords, including estimated spend and placements.
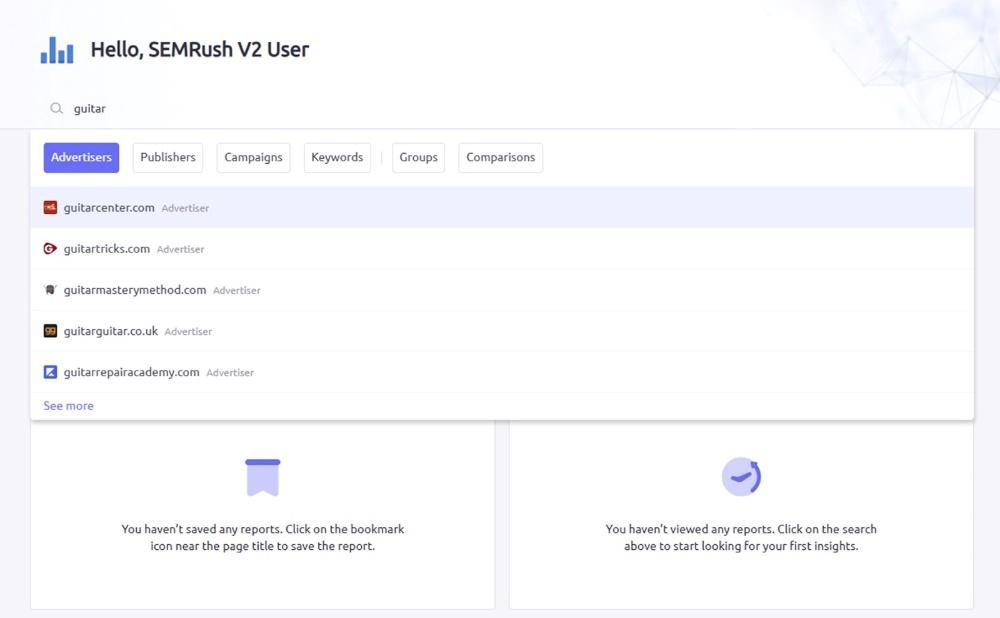
You can click on relevant results to add them to our reports until you’re ready to generate it in full.
Quick tip: if you’re running a search, ditch the “www.” and “https://” just enter the domain name straight (like semrush.com) or you’ll end up yelling at your screen when nothing loads.
Another bonus, if you want to view more than one domain, you can group consolidated data for selected domains, or analyze up to 10 domains against one another.
Once you’ve created your reports, you can filter through it by advertising channel, device type, time scale, and location (although your options do vary depending on your subscription).
Comparison Mode

I only touched on this lightly above, but if you want to view results from more than one domain at once, you definitely can.
You can create groups, or comparisons, just by adding multiple results to your search bar. You can compare single advertisers to groups of advertisers, or just look at how one company compares to another.
One note, if you save data to a group, it’ll all be merged as part of a comprehensive report. If you run a comparison, you’ll be able to access separate data for each domain.
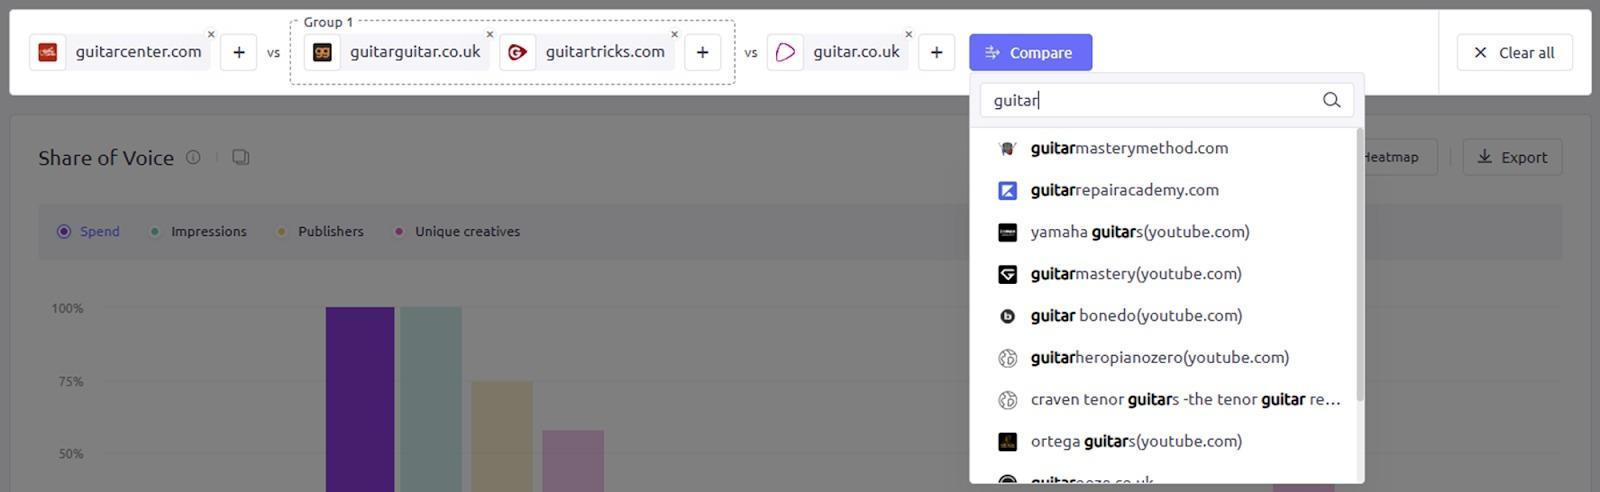
You can stack up to ten competitors side by side, and you can filter through your results, just like you could with a standard report. Plus, you can set up alerts for your group and comparison reports too – more on that in a moment.
The Dashboard Widgets
Now for the dashboards, which are basically your command center. Here are the highlights I keep coming back to:
- Estimated Expenditure: A tidy look at how much money is flowing into these campaigns over time (with handy percentage changes to spot spikes).
- Ad Types Distribution: Pie charts galore, breaking down exactly which formats are in play (and yes, you can see social-specific formats like carousels or stories).
- Ad Placement: Maps where the ads are appearing and how often.
- Ad Buying Methods: Shows whether they’re going direct, programmatic, or via networks.
- Share of Voice: This one only pops up in Comparison Mode but is priceless for seeing who’s dominating.
- Top Ads and Campaigns: Thumbnail previews and performance metrics so you can see what’s getting traction.
- YouTube Channels & Social Networks: Especially useful if video or social is your bread and butter.
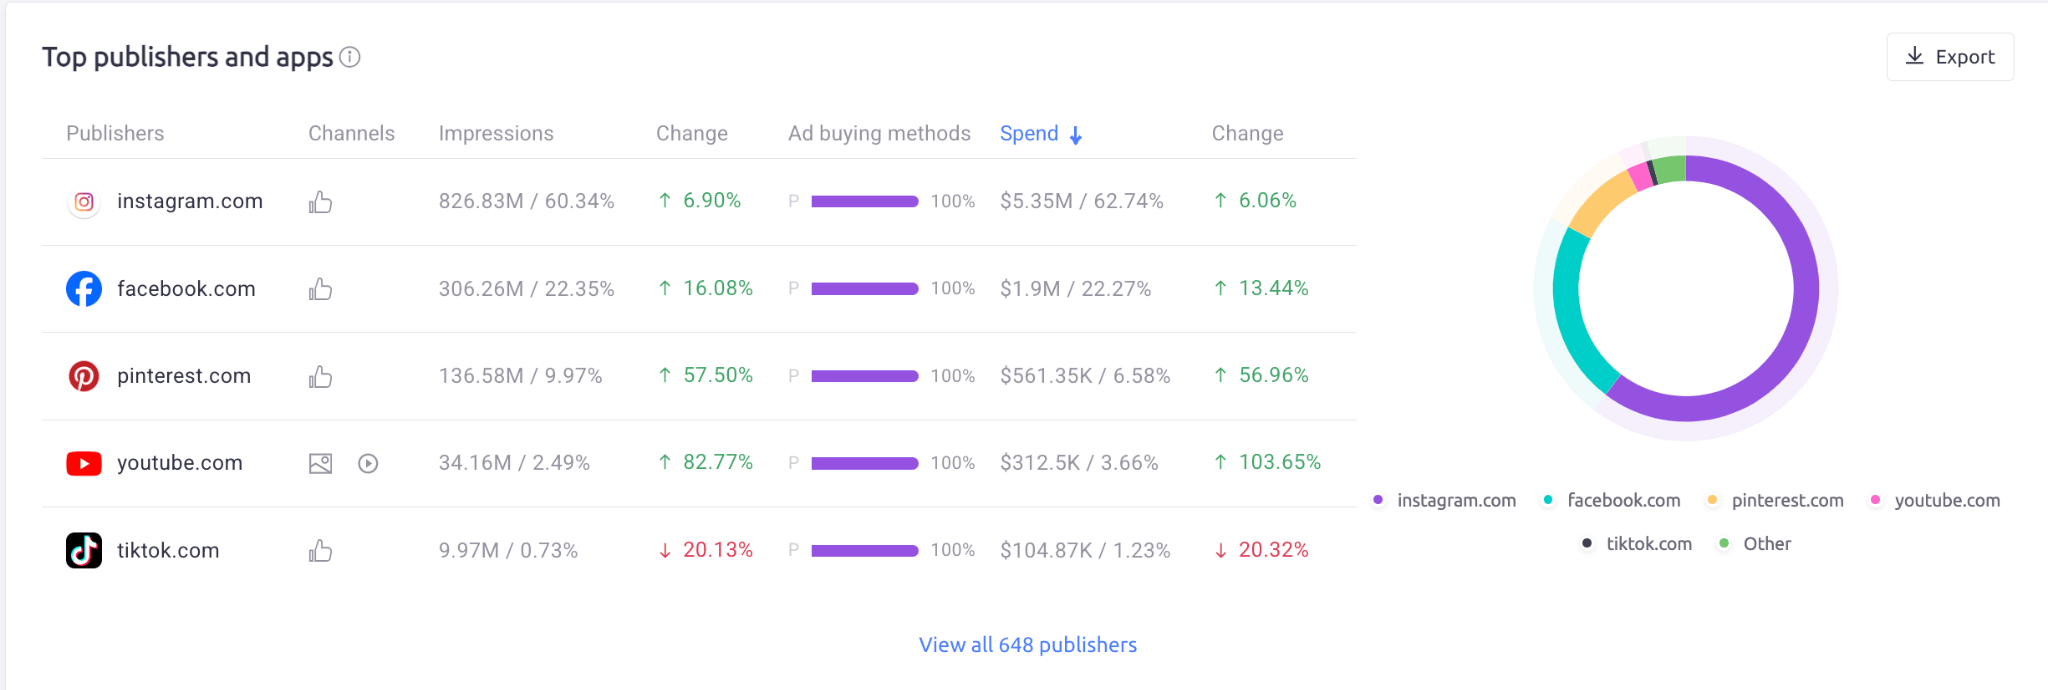
- Top Publishers and Apps: Great for finding out which placements might be worth pursuing yourself.
Exports & Alerts
Now, let’s talk about one of the most overlooked features of using AdClarity: exports.
Look, I love a good dashboard, but sometimes you just need to yank all that data out and play with it on your own turf.
Maybe you’re the spreadsheet type. Maybe you want to build your own visuals for a strategy doc. Or maybe you’re just a little paranoid and want your own backup copy.
AdClarity makes this simple. Pretty much every report and widget can be exported straight to PDF or Excel. Just keep in mind: depending on your subscription plan, there are limits to how many Excel exports you get per month.
PDFs are unlimited (which is nice if you want to print out a stack of reports and go full conspiracy wall with red string).
Then there are alerts, which I can’t recommend highly enough. You can subscribe to weekly or monthly email notifications, so you never miss a spike in spend or a sudden surge in creative launches.
How Much Does AdClarity Cost? Pricing & Plans
While AdClarity is available to add to Semrush, it’s not there for free. But before you decide it’s out of reach, let’s break down what you’re actually paying for: and why it could still be worth it. There are a few tiers you can choose from inside Semrush:
- Starter ($129/month): You get access to core features, but you’re capped at 3 months of historical data and how many reports you can run. Plus, the user can only pick one platform out of 3.
- Professional ($298/month): Here, you get up to 6 months of historical data (huge if you care about seasonality), more monthly reports, access to all platforms at once, and more exports.
- Team ($349/month): Essentially everything in Professional plus expanded limits (up to 12 months of historical data) and extra seats for larger teams.
Keep in mind, if you want additional markets (say you’re targeting France, Brazil, and Japan), each one costs $69/month extra.
Exports to Excel are also limited per month depending on your plan, while PDFs are unlimited.
So, yes, this is pricey, but it’s still potentially worth it. If you’re serious about digital advertising and you’re spending even a few thousand dollars a month, the ability to see exactly where your competitors are investing (and how they’re messaging) can pay for itself in a single smart pivot.
AdClarity: The Pros & Cons
Before I leave you with my final verdict, I wanted to give you a quick rundown of what’s really great – and not so great about AdClarity.
The Pros
- Comprehensive Coverage: 650,000+ publishers, 51 countries, and every major channel you care about. If you’ve ever wanted a bird’s-eye view of what’s happening across display, social, video, mobile apps, and CTV, this is it.
- Beautiful, Actionable Visuals: The dashboards are amazing. They’re clean, well-organized, and full of widgets that actually help you answer questions fast.
- Powerful Comparison Mode: Being able to stack competitors side by side and see who’s winning the spend war is incredibly useful.
- Granular Filters; Markets, devices, timeframes, ad formats: if you can think of a way you’d want to slice the data, odds are it’s already built in.
- Seamless Semrush Integration: If you’re already using Semrush for SEO or PPC, adding AdClarity into the mix just makes sense. It’s all in the same dashboard, which saves you a lot of tab-hopping.
The Cons
- Not Cheap (Especially with Add-ons): You’re going to be paying anywhere from $129 to $349 per month, plus $69 per market if you need more than one.
- Data Estimates, Not Absolutes: Remember: this is based on panel and network sampling, not direct billing data. The spend numbers are educated estimates, not gospel.
- Steep Learning Curve: There’s quite a lot to figure out. If you’re new to data analysis, this all might seem a bit overwhelming at first.
Is AdClarity Worth It?
Realistically, not every company is going to need the massive amount of data that AdClarity provides. But if you care about staying competitive, it’s hard to underestimate the impact of this tool.
It’s one thing to run ads. It’s another to see the chessboard and know what everyone else is doing, and adjust accordingly.
That can really give you an edge if you know how to use the information correctly. I’d definitely recommend this for:
- Performance marketers who need to understand the creative and channel mix of their fiercest competitors.
- Media buyers who are constantly testing new placements and want proof before they pitch new budgets.
- Growth teams hunting for overlooked publisher partnerships.
- Brand strategists trying to spot shifts in spend and creative themes.
It’s not exactly plug-and play. The tools take some getting used to, and the pricing is pretty expensive, so you might have trouble justifying it if you’re running a smaller business.
But if you’ve got the budget, and the time – AdClarity is worth exploring.


