Pick Shopify and you’re probably launching a fashion or beauty DTC brand. Pick Shopify Plus or Adobe Commerce and you’re probably running B2B or a complex catalog. Pick Squarespace and you’re probably a creative business with a small store bolted on. Pick BigCommerce and you’re probably scaling past Shopify into multi-channel.
We have spent ten years curating a gallery of design-led ecommerce stores. We sat down to look at what 4,118 of them have in common, and the platform-by-platform brand clustering is sharper than we expected.
- Wellness DTC clusters on Shopify (Vegan 1.64x, Wellness 1.59x, Sustainable 1.65x).
- Mid-market apparel clusters on Magento Community (Footwear 2.48x, Eyewear 2.91x, Menswear 2.12x).
- Indie handmade clusters on WooCommerce (Coffee 2.00x, Handmade 1.94x, Ethical 1.86x).
- Art and small beverage cluster on Squarespace (Prints 3.66x, Art 2.88x, Drink 3.33x).
- Outdoor clusters on BigCommerce at 3.97x lift — the single largest tag-platform pairing in the dataset.
That clustering reshapes how you should think about the ecommerce tech stack. Picking a platform is not just a hosting decision. It is a peer-group decision, an app-ecosystem decision, and a tool-stack decision in disguise.
The three findings
- Platforms predict your brand cohort. Each platform clusters around a different brand archetype. The cohort matters because the apps, conventions, agency expertise, and peer benchmarks all travel with it.
- The tool stack is mostly chosen for you, by the platform. Email, reviews, payments, search, even your CMS in some cases. Migrate the platform, you migrate the tooling.
- Three stack archetypes do most of the work. Marketing-heavy, Engineering-mature, and Service-led. They barely overlap. Most stores run one consistently.
Here is what that means if you are picking a platform, scaling a stack, or weighing a migration.
1. Picking a platform picks your peer group.
Tell us your platform and we can predict the kind of brand you run, with embarrassing accuracy.

Each platform has a signature category.
| Platform | Signature tags (highest lift) | What this is |
|---|---|---|
| Shopify | Snacks (1.96x), Plant-based (1.82x), Personal care (1.76x), Sustainable (1.65x), Vegan (1.64x), Wellness (1.59x) | DTC consumer goods cluster |
| WooCommerce | Coffee (2.00x), Handmade (1.94x), Natural (2.19x), Ethical (1.86x), Stationery, Art | Indie / small-batch / craft |
| Magento Community | Eyewear (2.91x), Shoes (2.53x), Footwear (2.48x), Menswear (2.12x), Outwear, Dresses | Mid-market apparel and footwear |
| Squarespace | Prints (3.66x), Drink (3.33x), Beverage (3.08x), Art (2.88x), Design (2.00x) | Single-creator art and beverage |
| Custom / Unknown | Typography (2.99x), Digital (2.76x), Graphic Design (2.01x), Furniture, Technology, Subscription | Editorial / design / enterprise (see Section 4) |
| BigCommerce | Outdoor (3.97x — the single largest lift in the dataset) | Niche outdoor enthusiast |
External corroboration: Harley Finkelstein, Shopify’s president, publicly cited 16 enterprise launches to Shopify in Q3 2024, with named brands including Dermalogica, HanesBrands, Orlebar Brown, and J.McLaughlin migrating off Salesforce Commerce Cloud and Magento. The migration tide is actively adding mid-market apparel and beauty to Shopify Plus.
What this means if you’re picking:
- Wellness DTC startup on Squarespace = working alone. No peers, no proven app stack.
- Same brand on Shopify = a hundred peers six months ahead of you.
- Magento Community footwear and eyewear cohorts are real, but watch the migration tide. 16 enterprise launches per quarter to Shopify Plus is meaningful.
- BigCommerce + Outdoor at 3.97x lift is the strongest tag-platform pairing in the dataset. Sample is small (12 sites) but the signal is clean.
- Pick the platform whose cohort is yours, not the one with the slickest marketing site.
2. Klaviyo lives on Shopify. Mailchimp lives everywhere else.
The split is so clean it almost looks fabricated.
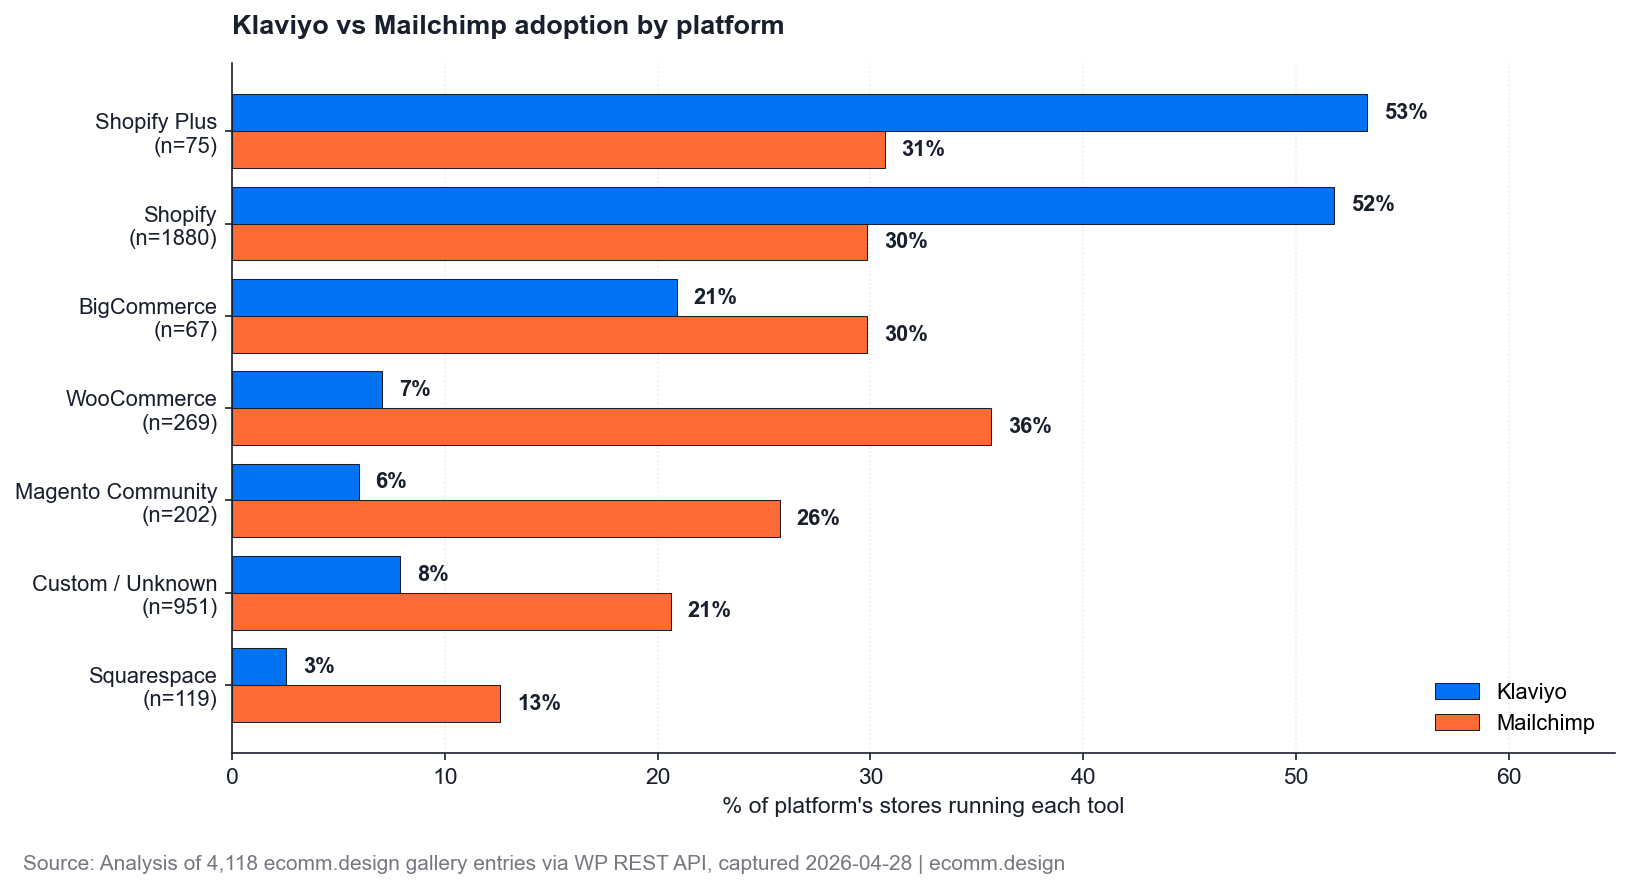
| Platform | Klaviyo | Mailchimp | Wins |
|---|---|---|---|
| Shopify Plus | 53% | 31% | Klaviyo |
| Shopify | 52% | 30% | Klaviyo |
| BigCommerce | 21% | 30% | Mailchimp |
| Custom / Unknown | 8% | 21% | Mailchimp |
| WooCommerce | 7% | 36% | Mailchimp |
| Magento Community | 6% | 26% | Mailchimp |
| Squarespace | 3% | 13% | Mailchimp |
Klaviyo wins Shopify and Shopify Plus. Mailchimp wins everything else. There is no middle.
The structural confirmation comes from Klaviyo’s own financials
- Klaviyo’s investor disclosures (per Jason Lemkin at SaaStr): 78% of Klaviyo’s $1.2B ARR comes from Shopify merchants. Unchanged since IPO in 2023 despite stated diversification effort.
- The Shopify-Klaviyo collaboration agreement runs through 2029.
- BuiltWith reports 428,659 sites running both Shopify and Klaviyo. Against ~2.8M total Shopify stores per StoreLeads, that’s ~15% internet-wide vs our gallery’s 52%. The gap reflects design-led / marketing-mature brands.
The lock-in is in the cap table.
Reviews tooling tells the same story from the other side
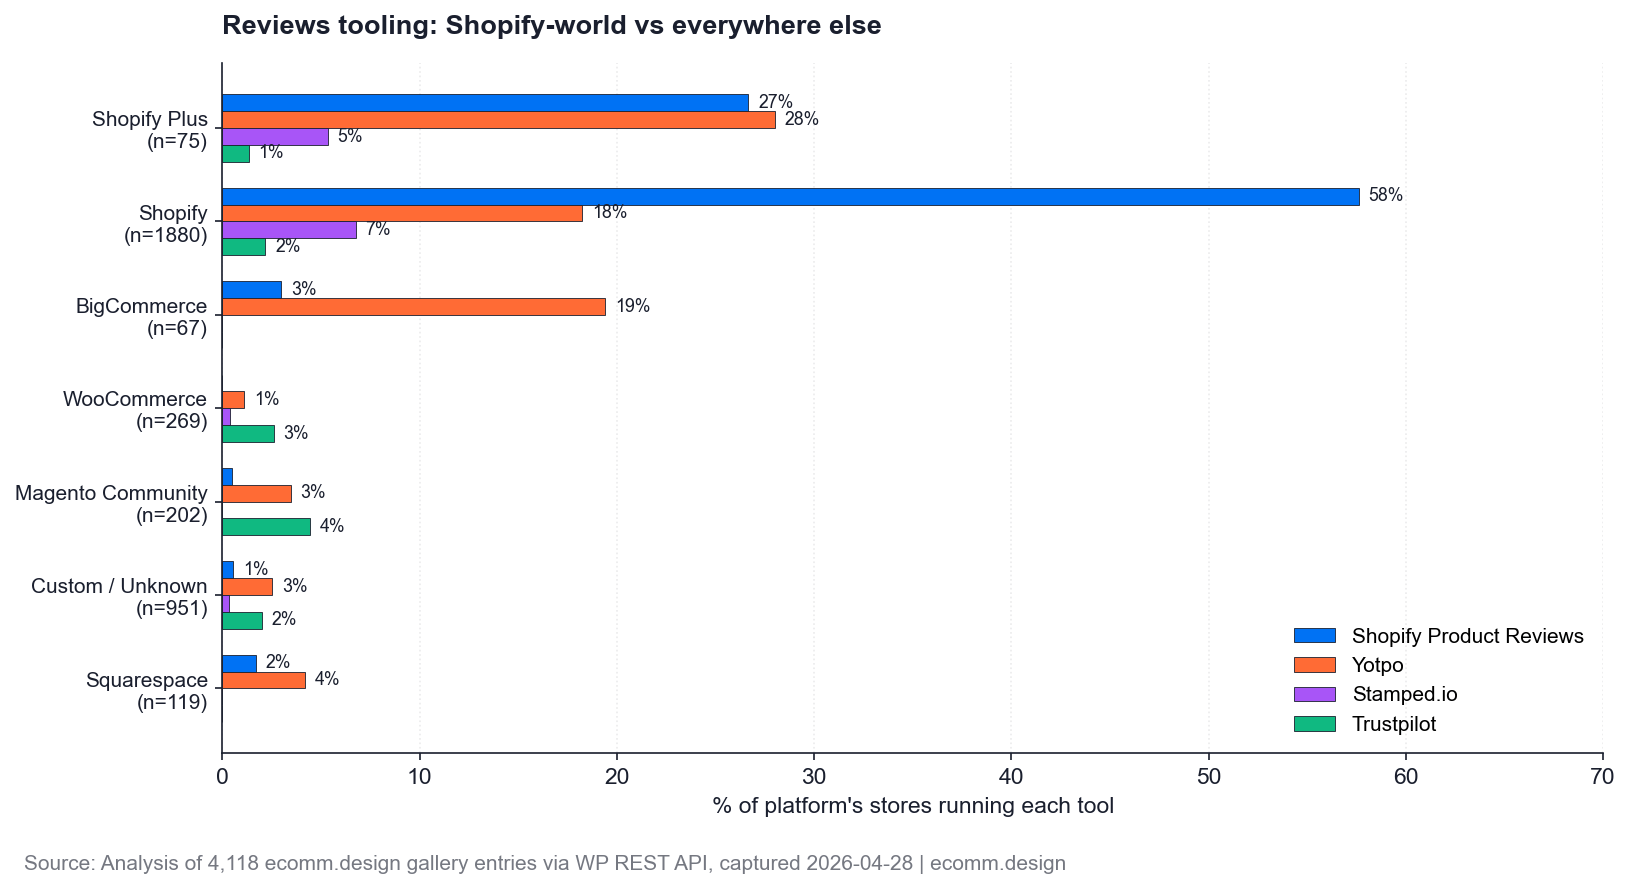
- Shopify Product Reviews: 58% on Shopify. Effectively zero on WooCommerce or Magento.
- Yotpo: 28% on Shopify Plus, 19% on BigCommerce, 18% on Shopify. 1% on WooCommerce, 3% on Magento Community.
- Trustpilot: tops out at 4% on any platform.
Reviews tooling barely exists outside Shopify-world. One structural reason WooCommerce stores often look thinner on social proof than their Shopify peers, even when the products are comparable.
Top 8 tools per platform — the fingerprints barely overlap
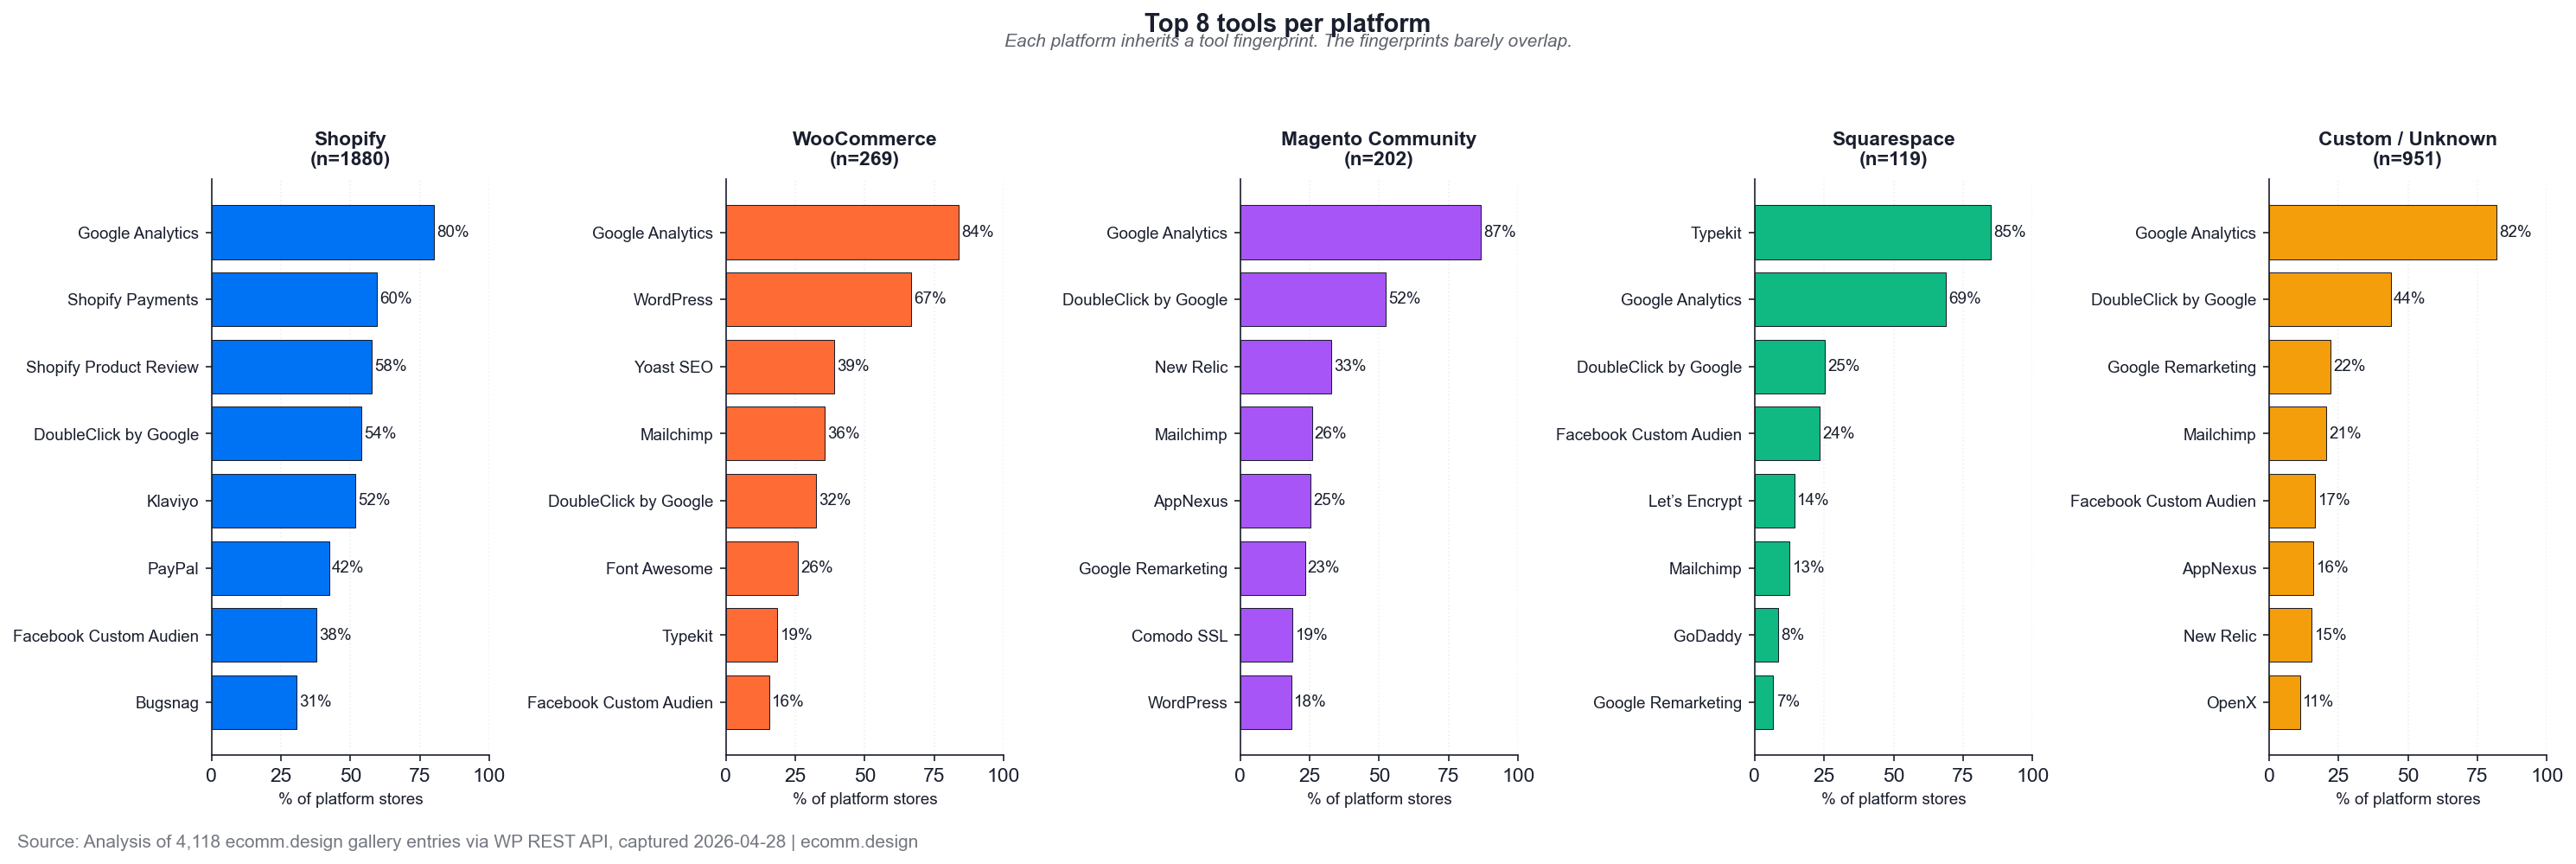
- Shopify-only tools: Shopify Payments (60%), Shopify Product Reviews (58%), Shopify Flow (11%), Recharge Payments (16%). None of these exist elsewhere.
- WooCommerce-only signature: WordPress (67%), Yoast SEO (39%), WP Rocket. None appear in the Shopify column.
- Magento Community signature: New Relic (33%), AppNexus (25%). Operationally serious mid-market footprint.
- Squarespace signature: Typekit (85%, bundled), almost nothing else third-party. Squarespace handles everything in-house.
What this means if you’re migrating:
- Off Shopify: re-buy email, reviews, payments, subscriptions. Klaviyo flows do not export. Plan a six-tool replacement before you sign the migration SOW.
- To Shopify: Klaviyo is the default whether you love it or not. The agency you hire will assume it. The peer brands you benchmark run it.
- Pick a platform, inherit a tool stack. The platform line item is rarely the most expensive part of a migration.
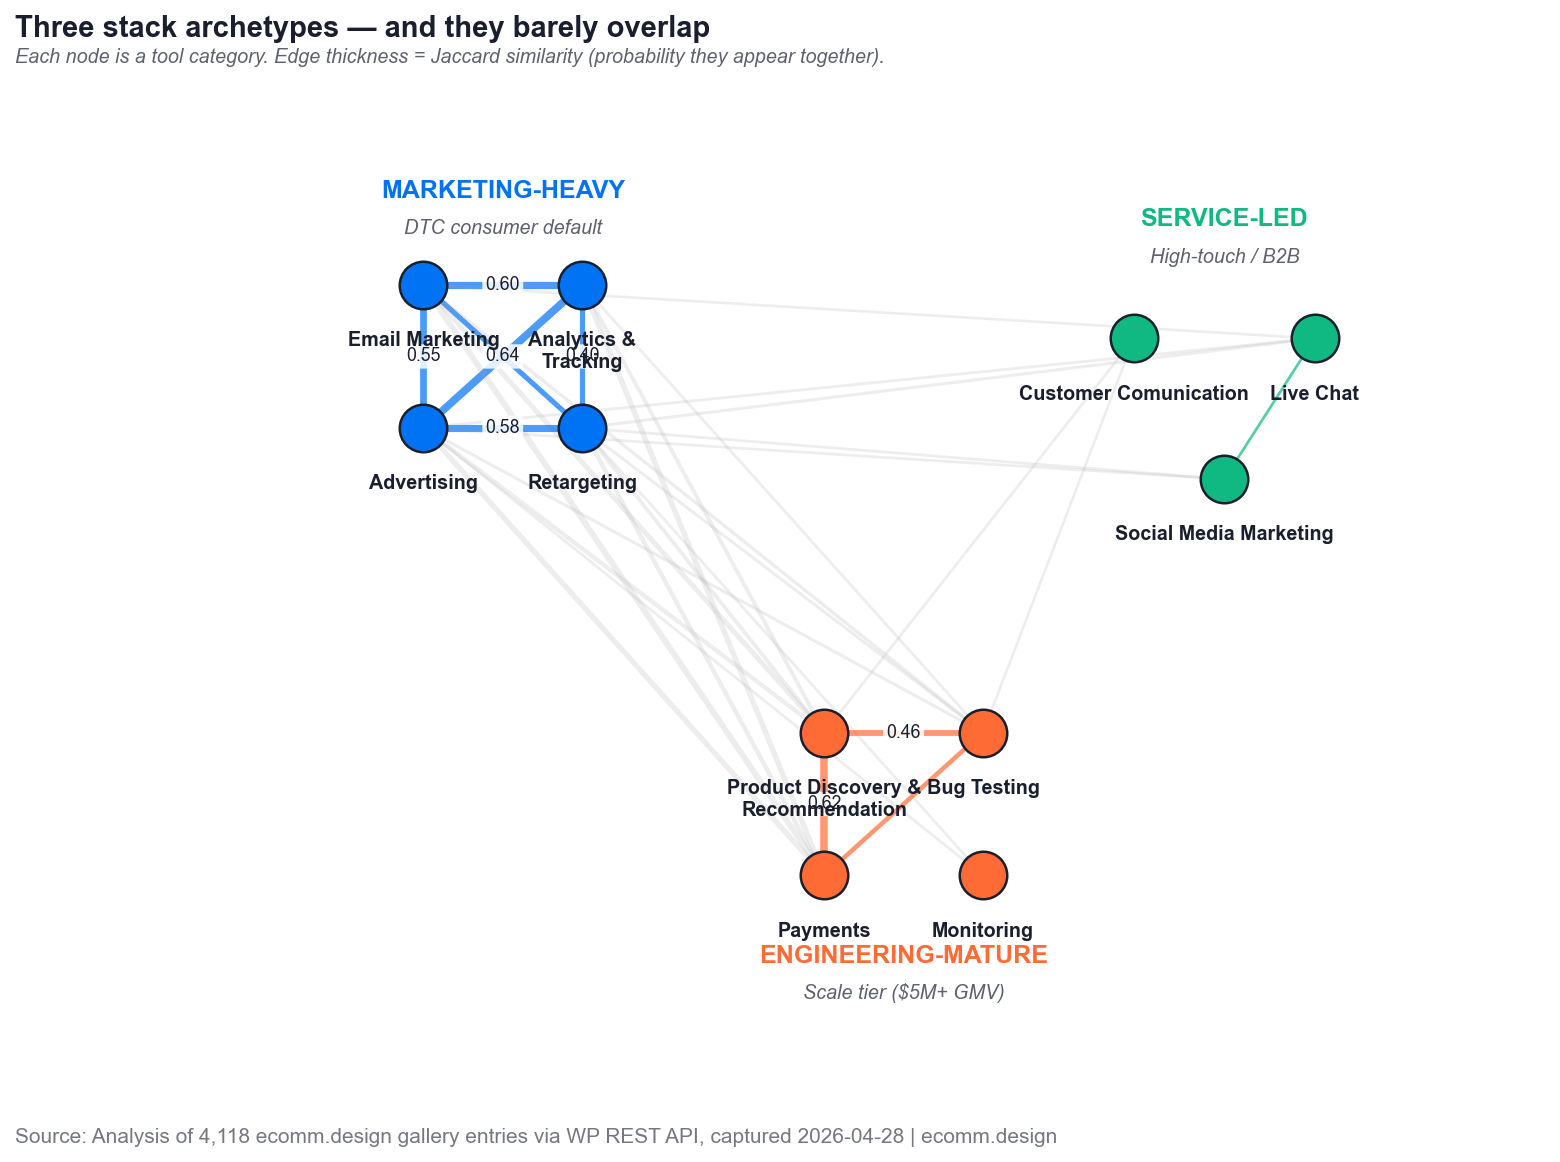
3. Three stack archetypes, and they barely overlap.
When you look at which tool categories travel together, three archetypes drop out of the data. They barely overlap.
| Archetype | Co-occurrence signal | Named tools | Operator read |
|---|---|---|---|
| Marketing-heavy (DTC consumer default) | Analytics + Advertising 0.64 Jaccard. Analytics + Email 0.60. Email + Advertising 0.55. Advertising + Retargeting 0.58. | Google Analytics (80% on Shopify), DoubleClick (54%), Facebook Custom Audiences (38%), Klaviyo or Mailchimp, AdRoll | If you’re DTC and you don’t run this stack, you’re behind your peers. Table-stakes for paid-acquisition growth. |
| Engineering-mature (scale tier) | Bug Testing → 89% probability of Product Discovery. 94% probability of Payments. Lift 3.1x and 2.2x. | Bugsnag, Sentry, Raygun, New Relic (15-33% on serious platforms), Algolia, sophisticated payments | At sub-$5M GMV this stack is over-tooled. You’re paying eng for capability you can’t deploy yet. If a competitor lists Bugsnag, treat it as scale-readiness signal. |
| Service-led (high-touch / B2B-leaning) | Live Chat ↔ Social Media 2.2x lift. Live Chat ↔ Monitoring 1.9x lift. Live Chat ↔ Retargeting 1.7x lift. | Zendesk Chat (27% on Shopify Plus), Intercom, Olark, Drift | Live chat is a CS or sales staffing commitment, not a one-time tool spend. Stores that buy Intercom and don’t staff it underperform stores that ignored chat entirely. |
What does NOT travel together is informative too:
- Bug Testing and Live Chat almost never coexist (Jaccard 0.07, just 76 stores together).
- Bug Testing and Social Media Marketing barely overlap (0.06, 68 stores).
- Engineering-mature stores don’t run live chat. Their conversion logic lives in the funnel, not the conversation.
The tool-count distribution backs the archetype split
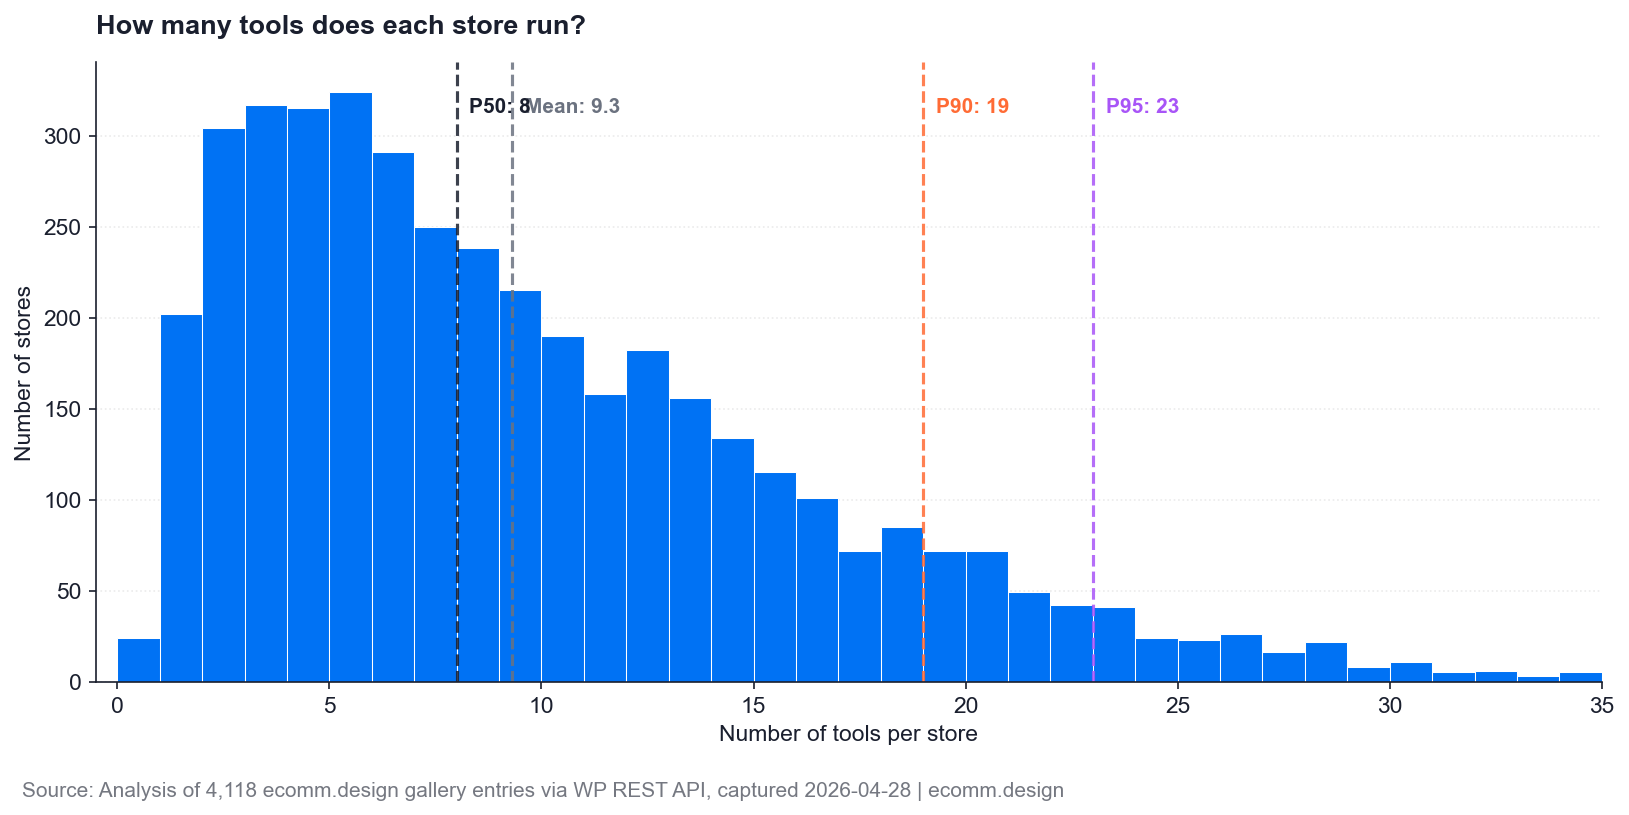
- P50 = 8 tools per store. P90 = 19. P95 = 23. Max = 51. Mean = 9.3.
- The 252 stores running 21+ tools sit almost entirely in the Engineering-mature × Marketing-heavy intersection.
- The 1,462 stores running 1-5 tools sit mostly in the Service-led or single-creator Squarespace cohort.
Match your stack to your archetype. Mismatched stacks are where money leaks.
- DTC consumer brands without the marketing-heavy stack lose to peers running it.
- Sub-$5M stores running engineering-mature tooling pay for capability they can’t deploy.
- Service-led stacks without the headcount to staff them quietly underperform stacks half their size that did staff up.
4. 23% of the gallery is “Custom” or “Unknown.” That’s not what you think it is.
23% of the gallery is “Custom” or “Unknown.”
When we first saw that number, we assumed: indie brands, hand-rolled Rails apps, designers showing off bespoke work.
We were wrong.
The top tools in the Custom / Unknown cohort tell a different story:
| Tool | % of cohort | What it signals |
|---|---|---|
| Google Analytics | 82% | Universal baseline |
| DoubleClick by Google | 44% | Programmatic display |
| AppNexus | 16% | Programmatic ad exchange |
| New Relic | 15% | Application performance monitoring at scale |
| OpenX | 11% | Programmatic ad exchange |
| Zendesk Support | 11% | Enterprise CS |
| Criteo | 10% | Retargeting at scale |
| LiveRamp | 9% | Data onboarding / identity resolution |
| Optimizely | 9% | Enterprise A/B testing and personalisation |
| Mandrill | 9% | Mailchimp’s transactional email tier |
This is not indie. This is enterprise programmatic ad-tech. Publishers, fashion houses, large editorial-led brands, and headless commerce implementations whose checkout layer is too bespoke to fingerprint cleanly. The label “Custom” is a fingerprinting limit, not a craft signal.
The tag pattern confirms it: Typography (2.99x lift), Digital (2.76x), Graphic Design (2.01x), Technology (1.81x), Furniture (1.56x), Subscription (1.81x). Editorial-flavoured, design-forward verticals, often with custom CMS layers (Contentful) and React/Next frontends stitched into custom commerce wrappers.
External cross-reference: StoreLeads’ internet-wide tracking lists “Custom Cart” as the third-largest category, 1.59M stores, 11.7% of live ecommerce. Web Almanac 2025 acknowledges a similar long tail. Neither source decomposes what the segment actually runs at the tool level.
What this means if you’re enterprise weighing custom vs platform:
- Your reference cohort is well-tooled programmatic operations, not “small DIY brands.”
- Plan a 6-12 person internal team, primary agency relationship at low six figures per quarter.
- If your custom-build budget is sized for a Shopify Plus build, you’re scoping the wrong reference class.
- The label “Custom” hides scale, it does not hide cost.
5. Most ecommerce brands aren’t testing anything.
- Only ~10% of the gallery (403 of 4,118 stores) carries an A/B testing tool.
- Optimizely is the most common, mostly on enterprise (9% of Custom / Unknown cohort).
- Personalisation tools sit at 11%.
- Hotjar (qualitative analytics, the closest informal experimentation signal) appears on 21% of Shopify stores. Concentrated, not universal.
The cohort that owns testing is enterprise. The cohort that should own testing — scaling DTC — mostly does not.
What this means for you:
When the CRO consultant tells you “everyone is running A/B tests now,” the data says they are not. About one in ten stores has the tooling. The implication flips: A/B testing in 2026 is not catching-up work. It is a competitive edge precisely because most of your peers aren’t doing it.
6. What this means when you’re picking, building, or migrating.
Three concrete scenarios. Three operator answers.
Scenario 1: DTC consumer brand, picking your first platform
- Answer: Shopify, almost always. Wellness, vegan, plant-based, sustainable, snacks, personal care, drink, nutrition — the lift numbers (1.59x to 1.96x) all point here.
- You inherit: Klaviyo (52% peer adoption), Shopify Product Reviews (58%), Shopify Payments (60%), and the marketing-heavy archetype stack from Section 3.
- The cost is genuine lock-in. Klaviyo flows don’t export. App subscriptions compound. Pick eyes-open.
Scenario 2: Scaling beyond $5M GMV, weighing migration
Worked example: Gymshark. Migrated from Adobe Commerce (Magento) to headless Shopify Plus. Post-migration stack:
- Commerce: Shopify Plus
- Search: Algolia
- Frontend: ReactJS
- CMS: Contentful
- Infrastructure: AWS
No tool from the Magento stack carried over. Outcome: handled 450,000 concurrent Black Friday users without crashes (the previous Magento storefront had crashed under similar load).
Ben Francis (Gymshark founder) summarised the velocity gap: things that “would have taken a lot of money and weeks to accomplish on Adobe Commerce” can be shipped on Shopify Plus “almost immediately.”
Web Almanac 2025 supplies the structural reason: 76% of Shopify stores pass Core Web Vitals vs 33% on WooCommerce and 36% on Magento.
Plan a minimum six-tool replacement: commerce, search, frontend framework, CMS, infrastructure, and most of your marketing stack. Email, reviews, payments all reset. Budget the tool migration alongside the platform migration. They’re inseparable.
Scenario 3: Enterprise weighing custom-build vs Shopify Plus / Adobe Commerce
- Section 4’s Custom / Unknown cohort is your realistic comparison set.
- Reference profile: New Relic (15%), AppNexus (16%), Optimizely (9%), LiveRamp (9%), Criteo (10%).
- The five engineering-readiness signals: Bug Testing, Product Discovery and Recommendation, serious Payments, Monitoring, dedicated CMS. Stores with all five sit in the top 5% of the gallery by tool count (P95 = 23 tools).
- Headcount, agency budget, and tooling spend should match the enterprise programmatic profile — typically 6-12 person internal team, primary agency relationship at low six figures per quarter.
7. How we ran the numbers.
This analysis draws on the curated gallery we have been building since 2016. 4,118 design-led ecommerce stores, ten years of curation, captured through April 2026.
For each store, we have:
- Platform — Shopify, WooCommerce, Magento, Squarespace, BigCommerce, Custom, and 70 others (99% coverage).
- Tool / tech stack — 657 distinct tools, an average of 9.3 per store, P95 of 23 (99.4% coverage).
- Product category tags — 1,283 distinct (99.6% coverage).
- Brand URL — 100%.
Cross-cutting analyses used in this article:
- Lift analysis — how much more likely a tag or tool is on a given platform vs the gallery as a whole. We use lift rather than raw share so the conclusions hold despite uneven platform representation.
- Co-occurrence analysis (Jaccard similarity) — the probability that two tool categories appear together on the same store. This surfaced the three stack archetypes.
- Conditional probability — given that a store runs tool A, how likely is it to also run tool B. This is what produced the 89% Bug Testing → Product Discovery finding.
Honest scope disclosure
Our gallery shows 46% Shopify and 7% WooCommerce. Internet-wide it is the opposite. StoreLeads tracks 32.7% WooCommerce and 20.8% Shopify across 13.5M live stores. Web Almanac 2025 shows similar shape (35.4% WooCommerce, 21.5% Shopify desktop). We curate design-led, English-market stores.
Treat every platform percentage in this article as “who’s in the design-led cohort,” not “who runs ecommerce.”
Why design-led galleries skew this way: Web Almanac 2025 reports 76% of Shopify stores pass Core Web Vitals versus 33% on WooCommerce. Design-led galleries naturally over-weight platforms with a higher performance floor. That is curation effect, not measurement error, which is why we used lift analysis rather than raw counts.
Three honest scope notes:
- Each entry’s stack reflects the moment of capture, not today. A 2017 Magento store may have since migrated. We do not auto-refresh.
- The sample skews English-language and design-led. Web Almanac 2025 shows WooCommerce leads in 42 of 59 desktop geographies, many non-English markets we underrepresent.
- The gallery is curated for design quality. Stores with weak visual execution do not appear, regardless of sales.
If you want to use the data to make a decision, treat the lift numbers as the operator-relevant metric, not the raw shares.
Frequently asked questions
Is Ecomm.Design gallery actually representative?
Yes, intentionally. StoreLeads tracks every store including dormant and spam shops; we track design-led, actively curated brands. StoreLeads answers “what software runs the most stores.” We answer “what stack do design-led DTC brands actually use.” Our 46% Shopify share versus StoreLeads’ 20.8% confirms which brands end up in a design gallery. For platform decisions based on the design-led peer cohort, our numbers are the right input. For market sizing, use StoreLeads.
What about Wix and Webflow? They barely appear in your analysis.
Correct. StoreLeads counts 997,330 Wix stores internet-wide, the fourth-largest platform globally. Our gallery has 24 Wix entries and 35 Webflow entries combined, well under 2% of the sample. These platforms are large by raw store count but underrepresented in design-led DTC publication coverage. The gallery measures a tier of execution, not the full market.
Isn’t Klaviyo’s dominance on Shopify just because it is the most-promoted app in the Shopify App Store?
Distribution is one factor. The financials suggest more. Klaviyo’s investor disclosures show 78% of its $1.2B ARR comes from Shopify merchants, unchanged after two years of stated diversification effort (per Jason Lemkin at SaaStr, FY2025). The Shopify-Klaviyo collaboration runs through 2029. The lock-in is in the cap table. If you’re on Shopify, plan for Klaviyo. If you’re not, plan to do without it.
Your data spans 10 years (2016-2026). Could the tech stack data be stale for older entries?
Yes. Each entry’s stack reflects the moment of capture, not today. For directional findings (Klaviyo concentration, archetype clusters, reviews gap, Custom / Unknown decomposition), trends are consistent across all time periods. For exact tool counts, treat the numbers as an order-of-magnitude indicator. Use the lift numbers, not the raw shares.


